Les Jeux Olympiques et la coupe du Monde de football sont-ils rentables pour le Comité Olympique International (COI) et pour la Fédération Internationale de Football (FIFA), qui possèdent les droits de ces événements ?
Oui, absolument.
Sont-ils rentables pour les comités d’organisation qui les mettent en place ?
Des fois, mais rarement.
Pour la ville hôte et le gouvernement ?
Quasiment jamais.*
* Texte original : Are the Olympics and the Football World Cup profitable for the International Olympic Committee (IOC) and the Fédération Internationale de Football Association (FIFA), who own the rights to these events? Yes, very much so. Are they profitable for the organising committees that need to put them on? Sometimes, but not very often. For the host city and government? Hardly ever.
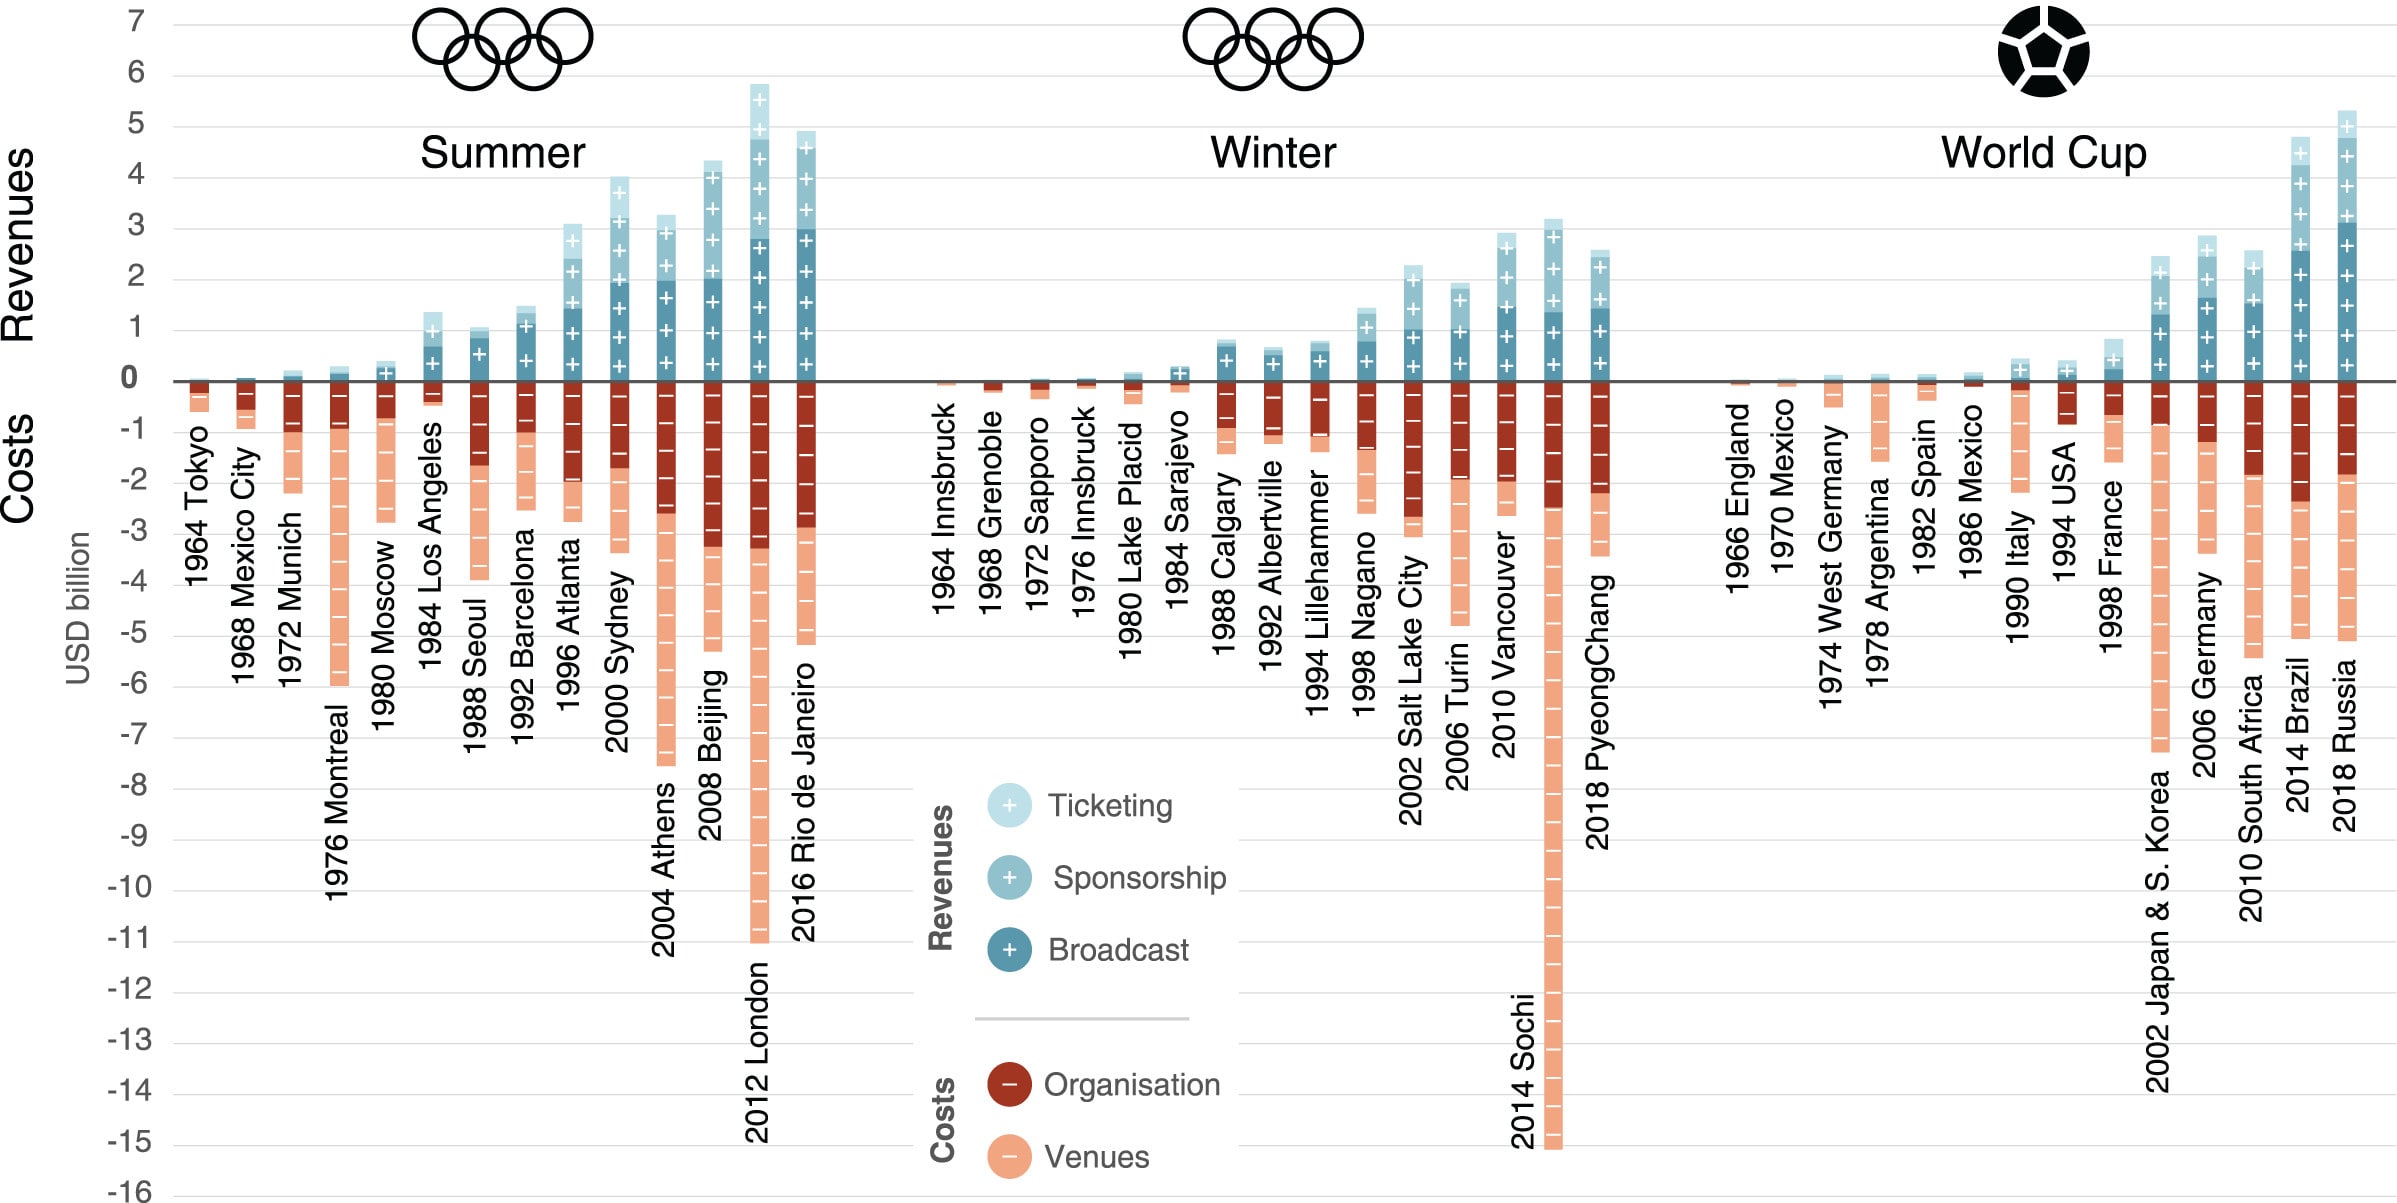
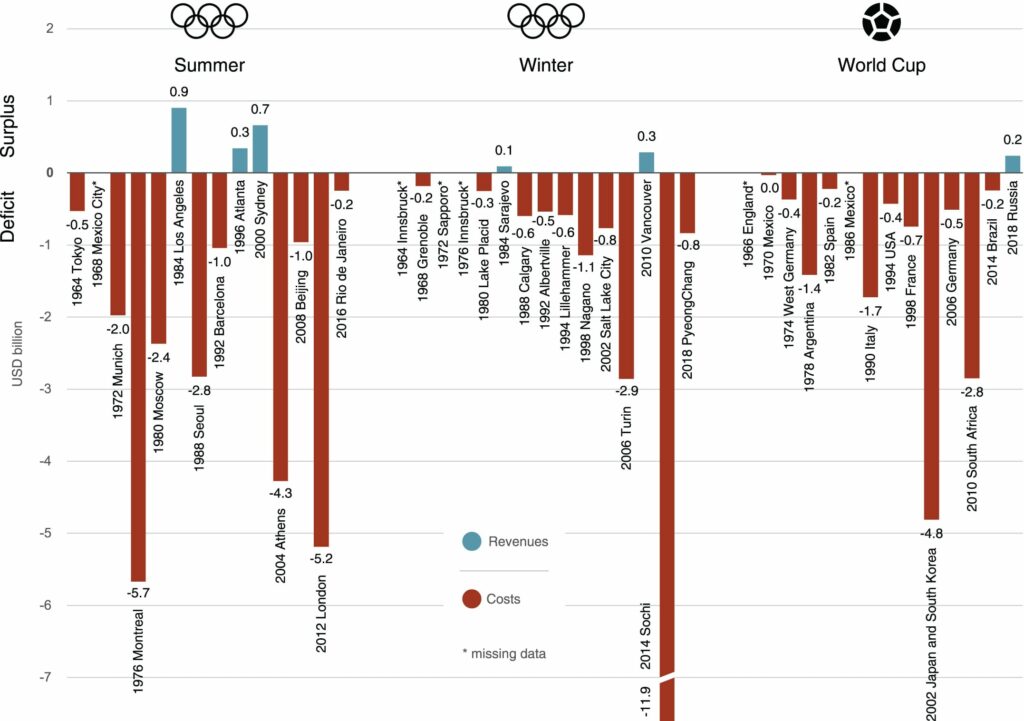
“Le déficit structurel des Jeux Olympiques et de la Coupe du monde de football : comparer les coûts et les revenus dans le temps” est une publication de juillet 2022, en anglais. Ses auteurs (Martin Müller, David Gogishvili, et Sven Daniel Wolfe) sont tous trois issus de l‘Institut de géographie et durabilité de l’université de Lausanne.
Voici 2 graphiques issus de cette publication :

Article original à lire ici :